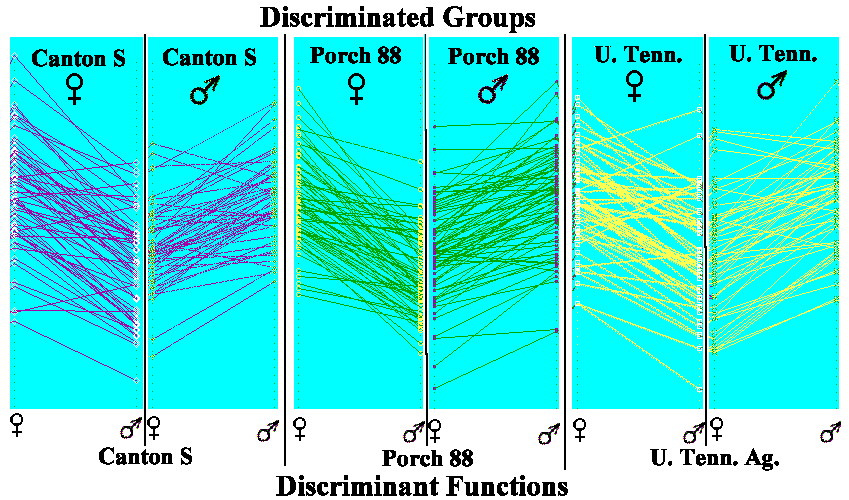

Figure 9. Sex discrimination using wing landmarks in Drosophila melanogaster. A set of discriminant functions, male and female, was calculated for each of three wild type strains. The paired functions were applied to their basis set of wings, males and females of their own strain. The male and female discriminant score (the log likelihood discriminant function) was plotted for each individual wing with a line connecting the two. In this figure the positive or negative slope of the line demonstrates the winning (higher) score. View the unreduced figure. A tabulated count (truth table) is produced by sorting the scores into true and false positives and negatives, Table II.