
Samples of 3-D Patterns Measured at UMass Amherst
Automated stereo scan of artificial twin proton point sources
using the ASET Software of Applicable Electronics and using R-scripts for
direct analysis of the ASET output.
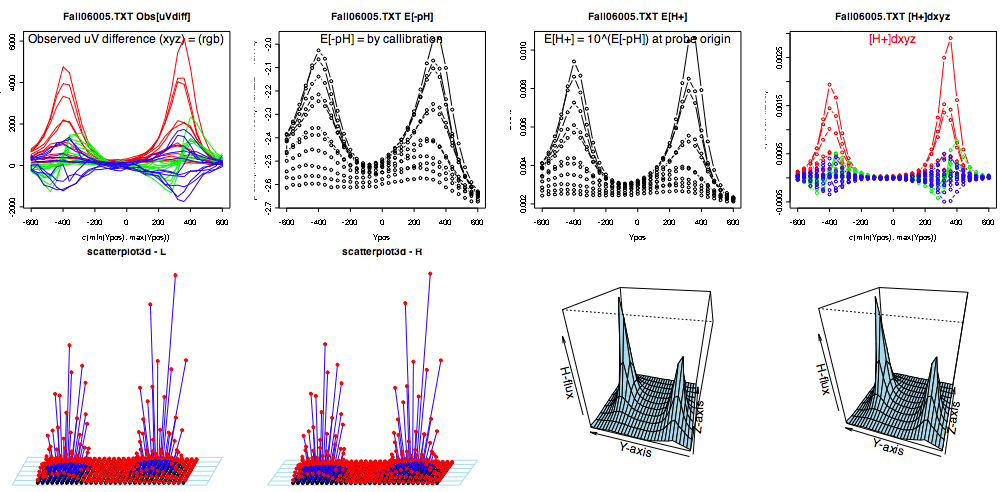
The top 4 panels illustrate the steps in analysis of the 3-D data obtained
by the ASET software. Panel 1 illustrates the three orthogonal microvolt
differences measured at a grid of observation points, uVdif(xyz), plotted on
the Y-axis as uVxyz in colors rgb. In panel 2 the expected -pH calculated from
the measured voltage at the origin of
each grid point measurement is based on the pH callibration curve. In panel 3
the Expected proton concentration at the grid popint origins is calculated by
exponentiating the points in panel 2. The proton concentration difference is
then calculated in panel 4 from the voltage at the origin, the uV differences,
the calibration curve and the estimated dynamic efficiency of the sampling
protocol. For protons and chloride the dynamic efficiency for typical 3-D
measuring protocols used recently has been indistinguishable from 100%.
The bottom 4 panels illustrate the calculated fluxes calculated from the
upper panel data and plotted as stereo pairs of 3-D flux vectors (left pair) or
total flux (right pair).
Gnu-Public R analysis includes library
plotting functions scatterplot3d() and grid plotting function
persp().
An older automatic triple scan of artificial twin proton
point sources
with a vibrating proton selective microelectrode,
NVPH.
The data was collected using the VPW software from Science Wares using a
Direct Coupled Ion Probe Amplifier from Applicable Electronics. The data is
plotted using Gnu-Public
QuikGrid Ver. 3.3
(formerly SURFACE.exe) from John Coulthard. While these programs are outdated
and no-longer available on modern platforms, the above mentioned R scripting language is now a Gnu-Public cross-platform alternative.
Stereo scan of a twin proton source with a
proton selective microelectrode 48 hours prior to the
above triple scan. This particular electrode survived for 6 days, faithfully
recording data from the same pair of artificial sources.
Data was prepared to plot using the MAGE software
available from Kinemage Duke.
Portions of adjacent follicles
from a Periplaneta americana ovariole
with a proton ion selective electrode poised at a
sampling site. Data from such
a follicle is displayed below.
Proton flux (red vectors) eminating from the anterior end of a
Periplaneta americana
follicle (Kunkel & Faszewski,
1995). The protons exit from the follicle epithelium (green outline)
seen to encase the
oocyte (yellow outline). This is a stereo pair produced with MAGE.
(blue marks the path of the scanning electrode).
Data was collected with a Direct Coupled Amplifier
using the 3DVIS software developed by Joe Kunkel at the NVP Facility at the MBL,
Woods Hole, MA.
View the kin file
If you have questions about visiting or using the University of Massachusetts
Vibrating Probe Facility,
email its PI, Joe Kunkel
Back to: |
Kunkel Home Page|
Biology Dept.|
UMass Home Page|